Paper marks are not an outcome.
Assets under management reflect who managed to deploy the most capital, rather than how effectively that capital was invested.
Odin Observations · October 2026
How much value each venture firm’s investments created for every dollar it put at risk, across 424 US listings from 2014 to 2026.
Most rankings of venture firms reward unicorns or private valuations. Funding activity shows who raised the most money, rather than who has created the most value.
This ranking asks a narrower question: for each dollar a firm put at risk, how much value did its investments create in companies that went on to list in the US?
The ranking
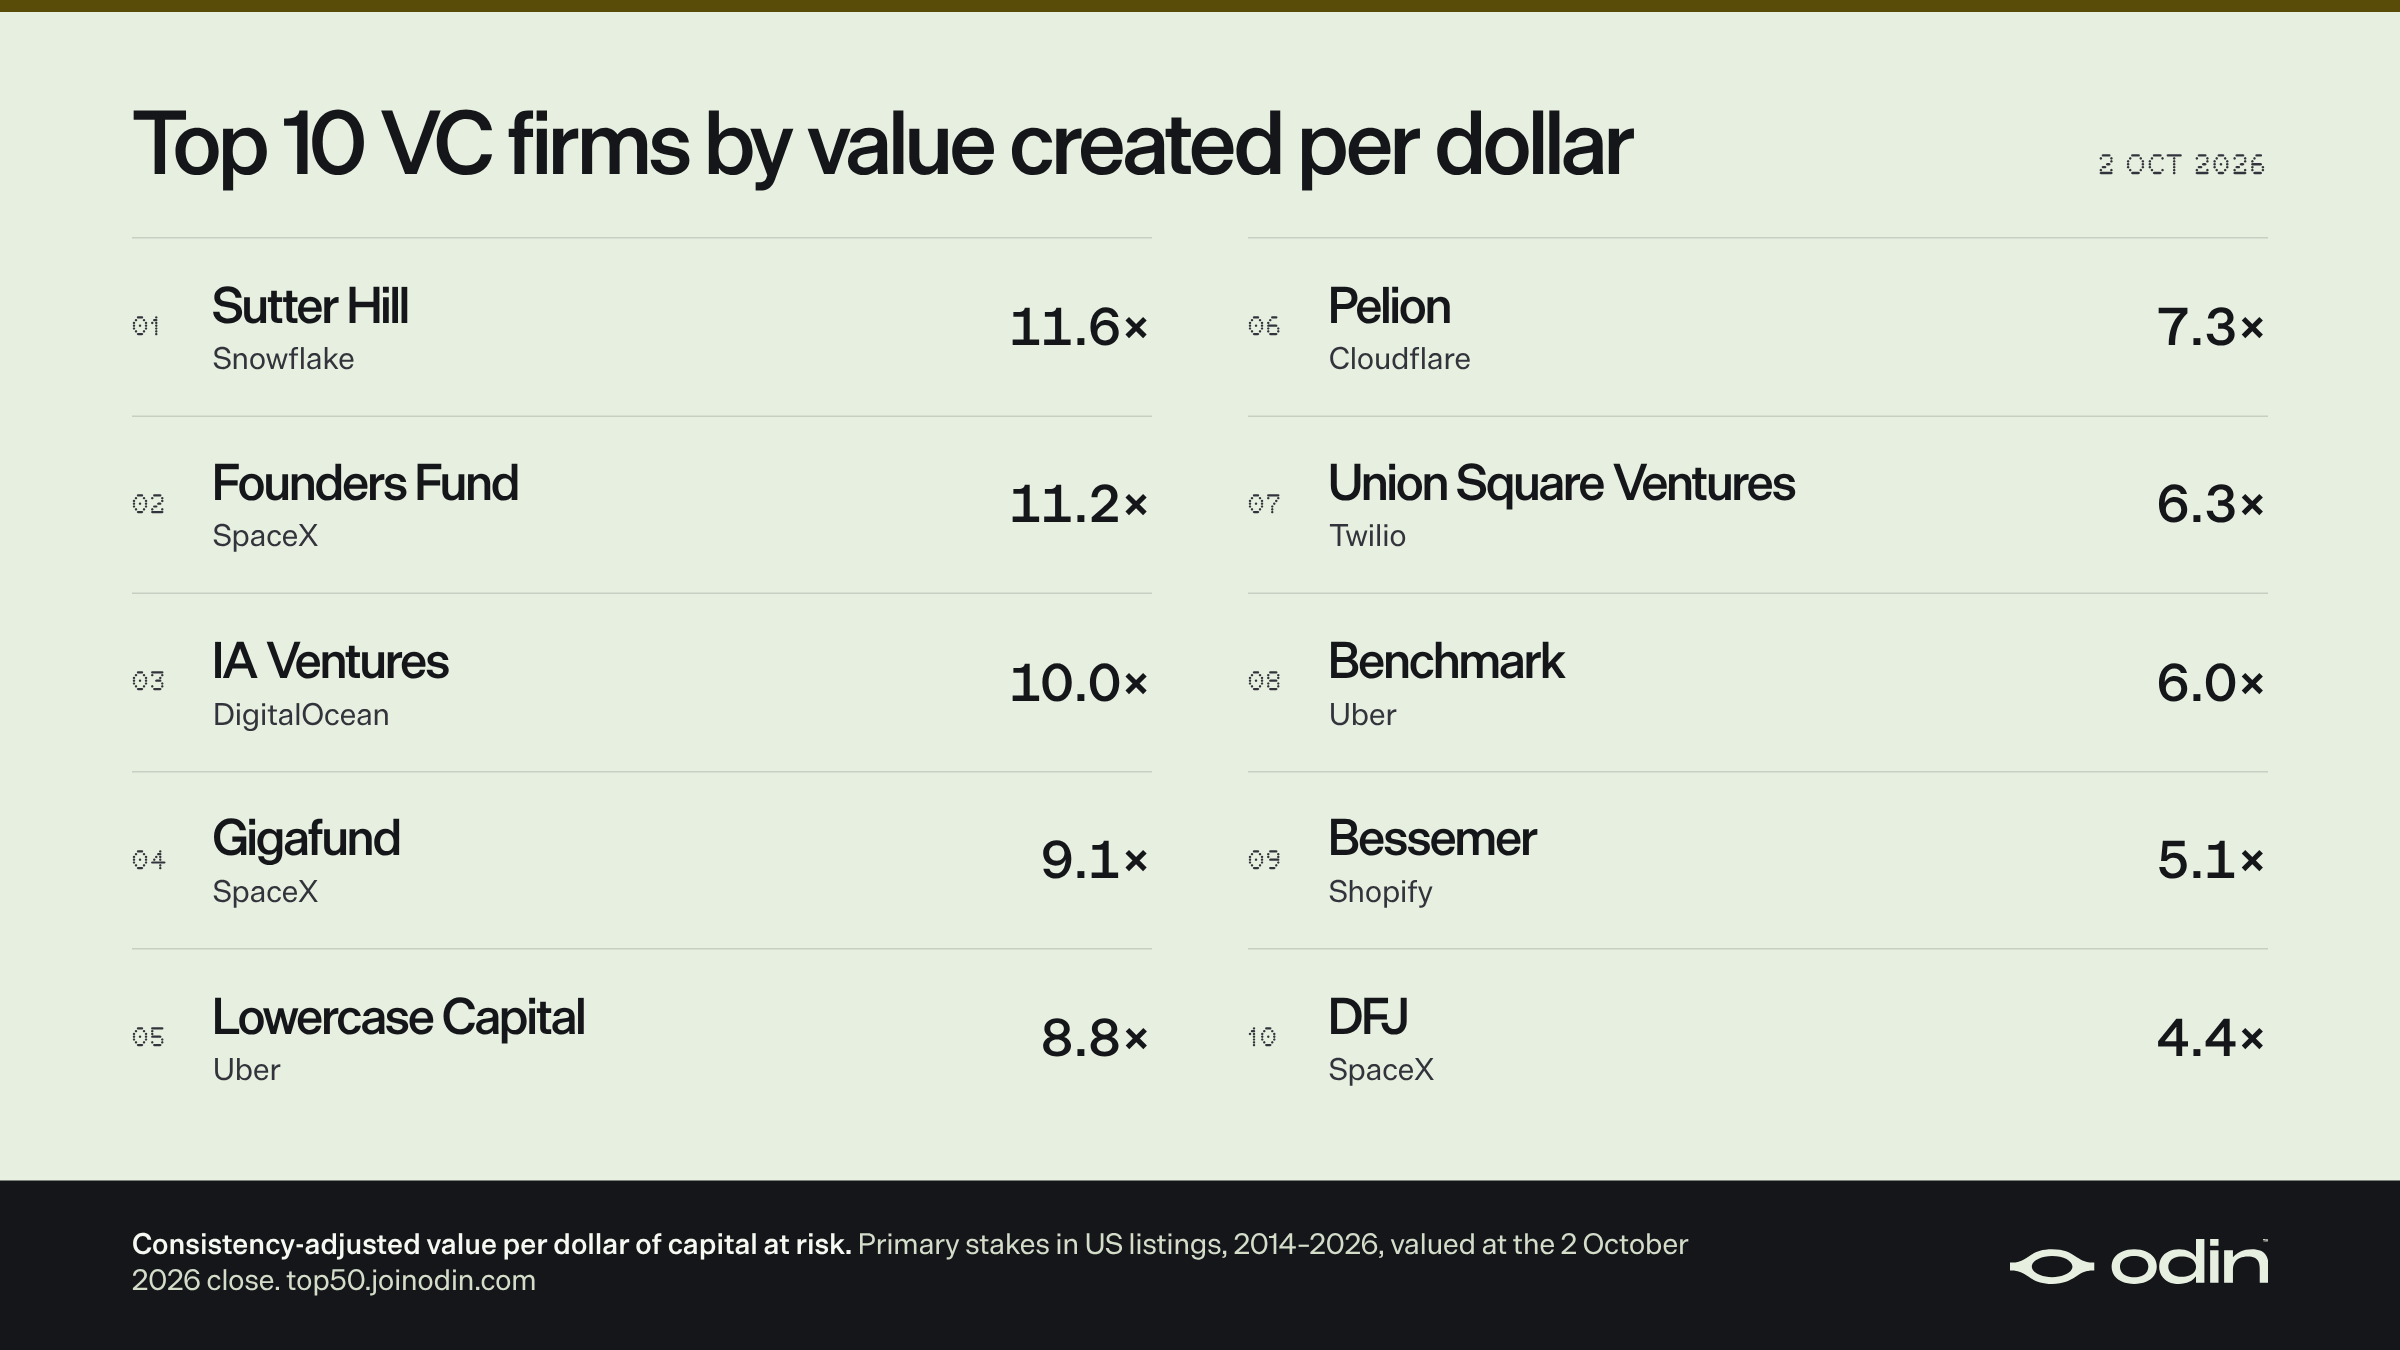
Firms ranked by consistency-adjusted value per dollar of capital at risk.
Ranks 11 to 50 open when you subscribe.
01Sutter Hill
Value per $ at risk11.6×Range 7.8–16.6×
| Rank | Firm | Value per $ | Value created | Capital at risk | Largest company |
|---|---|---|---|---|---|
| 01 | Sutter HillSnowflake (49%) | 11.6× | $19.1bn | $1.33bn | Snowflake (49%) |
| 02 | Founders FundSpaceX (63%) | 11.2× | $95.2bn | $6.16bn | SpaceX (63%) |
| 03 | IA VenturesDigitalOcean (49%) | 10.0× | $4.27bn | $344m | DigitalOcean (49%) |
| 04 | GigafundSpaceX (100%) | 9.1× | $11.0bn | $357m | SpaceX (100%) |
| 05 | Lowercase CapitalUber (98%) | 8.8× | $2.29bn | $98m | Uber (98%) |
| 06 | PelionCloudflare (100%) | 7.3× | $15.1bn | $660m | Cloudflare (100%) |
| 07 | Union Square VenturesTwilio (28%) | 6.3× | $10.2bn | $1.46bn | Twilio (28%) |
| 08 | BenchmarkUber (52%) | 6.0× | $18.0bn | $2.37bn | Uber (52%) |
| 09 | BessemerShopify (63%) | 5.1× | $48.4bn | $6.92bn | Shopify (63%) |
| 10 | DFJSpaceX (87%) | 4.4× | $29.8bn | $3.85bn | SpaceX (87%) |
Value created is what a firm’s primary stakes were worth at the 2 October 2026 close. Capital at risk is its funds’ commitments, scaled to the share of their listings expected in the window.
The method
Assets under management reflect who managed to deploy the most capital, rather than how effectively that capital was invested.
The last funding round is priced by people already inside the deal. A public listing gives a price anyone can check.
The best firms can hold shares for many years after IPO, and the best companies keep compounding.
Investments that contributed to the growth of a company, rather than riding on the success of an already obvious winner through secondaries.
Companies that listed in the US between January 2014 and June 2026: IPOs, direct listings and SPAC mergers. Life sciences are excluded.
Every value is the close on 2 October 2026. Later price moves don’t change the figures.
Each fund’s commitment, scaled by the share of its listings expected inside the window. A 2011 early-stage fund counts 92% of its size; a 2000 fund counts the 25% floor.
Value per dollar, weighted two-thirds, blended with value per dollar excluding the firm’s largest company, weighted one-third. One great company still counts, but it can’t carry a firm alone.
Estimated inputs, such as smaller stakes, some fund sizes and primary shares, carry low and high cases. Neighbouring firms’ ranges often overlap.
Independent venture firms investing pooled outside money, mainly in private technology companies. Family offices, individuals and single-company vehicles are listed separately in the data.
Acquisitions and companies still private are not counted, so every firm’s figure understates its full return; the comparison between firms is the point. Non-US listings are outside the window, and listings under $2bn that the first search missed were not added. Fees and carried interest are ignored: this is value created, not investor returns. Single outcomes matter: SpaceX alone is 37% of the value in the set.
The full findings
Subscribe to The Odin Times to open the rest of this page:
What you’re signing up for: The Odin Times, Odin’s newsletter on Substack. We’ll email you when Odin publishes new research and other articles, and new episodes of the Going Solo podcast series. You can unsubscribe at any time.
Once you’ve subscribed, you can open the rest of the page here.
Subscribed?
Thanks. The full report and findings are open below.Go to the report
Form not loading? Subscribe on Substack (opens in a new tab), then come back to this page.
Report
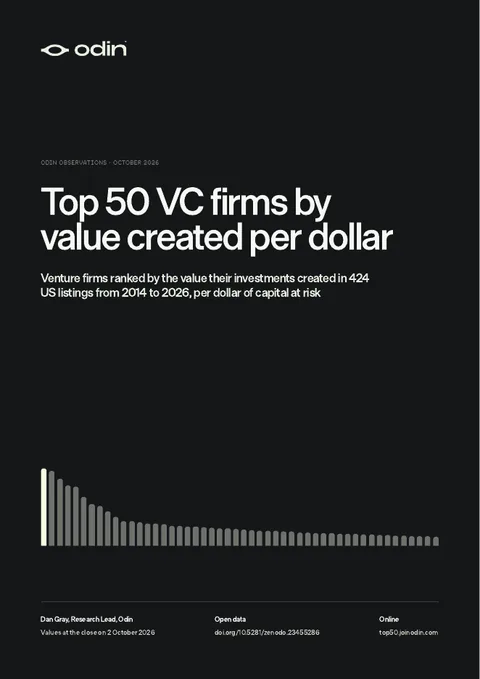
Everything behind this page in one PDF: the top 10 firms in detail, the method and how robust the ranking is, the sources and open data, the top 50 firms, the top 20 funds and the top 20 companies.
The full ranking
The top 50 on the same measure, valued at the 2 October 2026 close.
| Rank | Firm | Value per $ | Value created | Capital at risk | Largest company |
|---|---|---|---|---|---|
| 01 | Sutter HillSnowflake (49%) | 11.6× | $19.1bn | $1.33bn | Snowflake (49%) |
| 02 | Founders FundSpaceX (63%) | 11.2× | $95.2bn | $6.16bn | SpaceX (63%) |
| 03 | IA VenturesDigitalOcean (49%) | 10.0× | $4.27bn | $344m | DigitalOcean (49%) |
| 04 | GigafundSpaceX (100%) | 9.1× | $11.0bn | $357m | SpaceX (100%) |
| 05 | Lowercase CapitalUber (98%) | 8.8× | $2.29bn | $98m | Uber (98%) |
| 06 | PelionCloudflare (100%) | 7.3× | $15.1bn | $660m | Cloudflare (100%) |
| 07 | Union Square VenturesTwilio (28%) | 6.3× | $10.2bn | $1.46bn | Twilio (28%) |
| 08 | BenchmarkUber (52%) | 6.0× | $18.0bn | $2.37bn | Uber (52%) |
| 09 | BessemerShopify (63%) | 5.1× | $48.4bn | $6.92bn | Shopify (63%) |
| 10 | DFJSpaceX (87%) | 4.4× | $29.8bn | $3.85bn | SpaceX (87%) |
| 11 | GreylockAirbnb (25%) | 3.7× | $14.6bn | $3.55bn | Airbnb (25%) |
| 12 | Sequoia CapitalSpaceX (18%) | 3.7× | $82.6bn | $20.8bn | SpaceX (18%) |
| 13 | FirstMarkShopify (91%) | 3.5× | $13.2bn | $1.98bn | Shopify (91%) |
| 14 | Index VenturesDatadog (45%) | 3.4× | $30.5bn | $7.44bn | Datadog (45%) |
| 15 | Founder CollectiveThe Trade Desk (66%) | 3.3× | $850m | $183m | The Trade Desk (66%) |
| 16 | First Round CapitalUber (61%) | 3.3× | $4.37bn | $1bn | Uber (61%) |
| 17 | Granite VenturesAnaplan (78%) | 3.0× | $1.02bn | $218m | Anaplan (78%) |
| 18 | VenrockCloudflare (100%) | 3.0× | $14.7bn | $2.13bn | Cloudflare (100%) |
| 19 | RedpointSnowflake (60%) | 2.9× | $12.4bn | $3.22bn | Snowflake (60%) |
| 20 | Ribbit CapitalRobinhood (63%) | 2.9× | $11.5bn | $2.92bn | Robinhood (63%) |
| 21 | Contour Venture PartnersDatadog (100%) | 2.8× | $1.56bn | $242m | Datadog (100%) |
| 22 | Romulus CapitalEquipmentShare (100%) | 2.7× | $995m | $159m | EquipmentShare (100%) |
| 23 | Khosla VenturesRocket Lab (44%) | 2.6× | $19.2bn | $6.08bn | Rocket Lab (44%) |
| 24 | Gemini IsraelJFrog (92%) | 2.6× | $1.32bn | $276m | JFrog (92%) |
| 25 | AccelCrowdStrike (70%) | 2.6× | $56.0bn | $15.2bn | CrowdStrike (70%) |
| 26 | Glynn CapitalPalantir (62%) | 2.5× | $2.14bn | $647m | Palantir (62%) |
| 27 | Amplify PartnersDatadog (91%) | 2.3× | $2.34bn | $560m | Datadog (91%) |
| 28 | Andreessen HorowitzSpaceX (15%) | 2.3× | $30.8bn | $12.7bn | SpaceX (15%) |
| 29 | Harbor Pacific CapitalZoom (100%) | 2.3× | $149m | $30m | Zoom (100%) |
| 30 | Highway 12 VenturesSendGrid (100%) | 2.3× | $247m | $50m | SendGrid (100%) |
| 31 | March CapitalCrowdStrike (100%) | 2.2× | $5.73bn | $1.19bn | CrowdStrike (100%) |
| 32 | SV AngelAirbnb (21%) | 2.2× | $918m | $388m | Airbnb (21%) |
| 33 | Red SwanCoinbase (98%) | 2.0× | $71m | $18m | Coinbase (98%) |
| 34 | Banyan PartnersPinduoduo (92%) | 2.0× | $4.79bn | $1.36bn | Pinduoduo (92%) |
| 35 | Granite Hill Capital PartnersSentinelOne (100%) | 2.0× | $125m | $31m | SentinelOne (100%) |
| 36 | Emergence CapitalZoom (72%) | 1.9× | $3.31bn | $1.19bn | Zoom (72%) |
| 37 | Section 32Dave (73%) | 1.9× | $1.46bn | $532m | Dave (73%) |
| 38 | FlybridgeMongoDB (99%) | 1.8× | $1.7bn | $456m | MongoDB (99%) |
| 39 | Hummer WinbladMuleSoft (73%) | 1.8× | $1.1bn | $416m | MuleSoft (73%) |
| 40 | Y CombinatorDoorDash (37%) | 1.8× | $3.78bn | $1.8bn | DoorDash (37%) |
| 41 | Altos VenturesRoblox (100%) | 1.7× | $2.9bn | $826m | Roblox (100%) |
| 42 | JVPCyberArk (100%) | 1.7× | $3.8bn | $1.09bn | CyberArk (100%) |
| 43 | NEACloudflare (56%) | 1.7× | $33.0bn | $15.5bn | Cloudflare (56%) |
| 44 | Celesta CapitalCredo (100%) | 1.6× | $1.84bn | $566m | Credo (100%) |
| 45 | 8VCPalantir (96%) | 1.6× | $5.21bn | $1.77bn | Palantir (96%) |
| 46 | MadronaSmartsheet (48%) | 1.5× | $2.92bn | $1.56bn | Smartsheet (48%) |
| 47 | Cathay InnovationPinduoduo (74%) | 1.5× | $1.59bn | $742m | Pinduoduo (74%) |
| 48 | Revel PartnersThe Trade Desk (100%) | 1.5× | $93m | $32m | The Trade Desk (100%) |
| 49 | FelicisShopify (90%) | 1.4× | $2.24bn | $920m | Shopify (90%) |
| 50 | Mobius Venture CapitalBloom Energy (80%) | 1.4× | $1.11bn | $537m | Bloom Energy (80%) |
Companies
The five most valuable listings with venture-fund backers, valued at the 2 October 2026 close on the shares outstanding at listing. Alibaba and Arista Networks, also among the most valuable, had no venture-fund holders at listing.
The largest listing in the set: 37% of all the value, more than the next nine listings combined.
Listed directly, without an IPO. Founders Fund was the largest venture holder.
Funds
Single funds, ranked on the same measure. A fund can far outrun the firm that raised it.
Open data
The data comes from SEC filings, fund announcements and public reports. There will be gaps and mistakes. Everything is open under CC BY 4.0, so you can check any figure, suggest a correction and run your own analysis.
Cite as: Gray, D. (2026). Venture value created per dollar at risk: US venture-backed listings, 2014–2026 (Version 1.0.0) [Data set]. Odin. https://doi.org/10.5281/zenodo.23455286